This article was prepared with AI assistance based on an analysis of the current Lumina Studio source code, existing Wiki content, and relevant workflows. It has been checked against the current version, but omissions or details that become outdated may remain as the software evolves. If you find an error or have a clearer explanation, example, or suggestion, please leave a comment on this page or propose an edit on GitHub.
3D Viewer, Screenshot, Performance, and Diagnostics
After Preview or Generate, the 3D Viewer places the model on the selected machine's build-plate grid. Use it to inspect orientation, outline, structural additions, and approximate scale. It is not a slicer toolpath Preview.
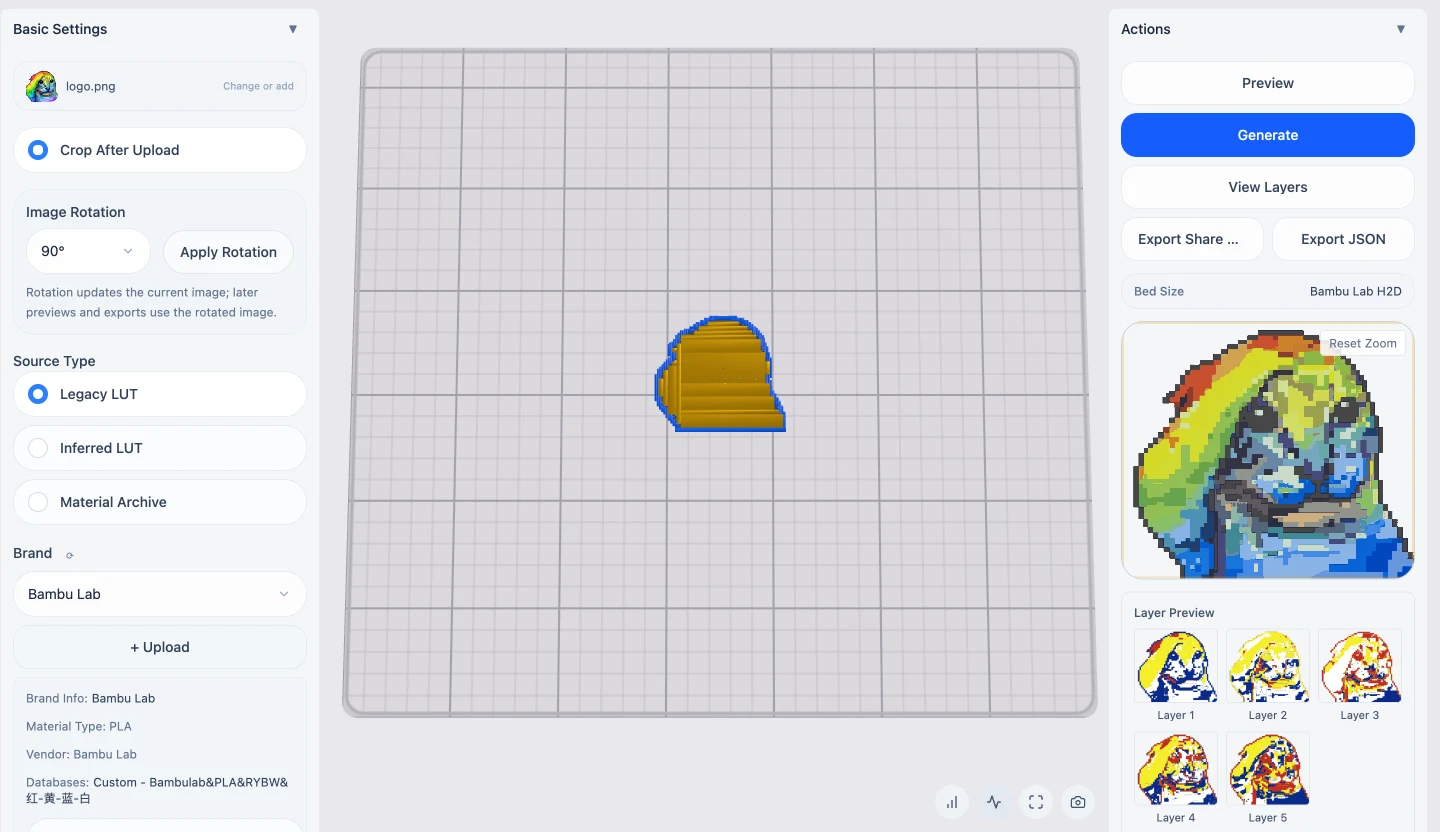
Camera interaction
- hold and drag on the canvas to orbit around the model;
- scroll the mouse wheel to move nearer or farther;
- camera movement uses damping and stops smoothly;
- selecting the canvas outside a model clears the active magnet when Fridge Magnet editing is on.
The camera permits a large distance range. If the model appears extremely small, verify target and Preview dimensions rather than using magnification alone to decide whether a feature is printable.
Four bottom-right controls
From left to right:
- Performance;
- Diagnostics;
- Fullscreen;
- Screenshot.
Fullscreen appears only when the browser exposes the Fullscreen API. Exiting returns to the same
workspace. Screenshot reads the current WebGL canvas and downloads
lumina-3d-screenshot-<timestamp>.png. It is a picture of the 3D canvas, not a share card, and
contains no recoverable recipe.
Performance
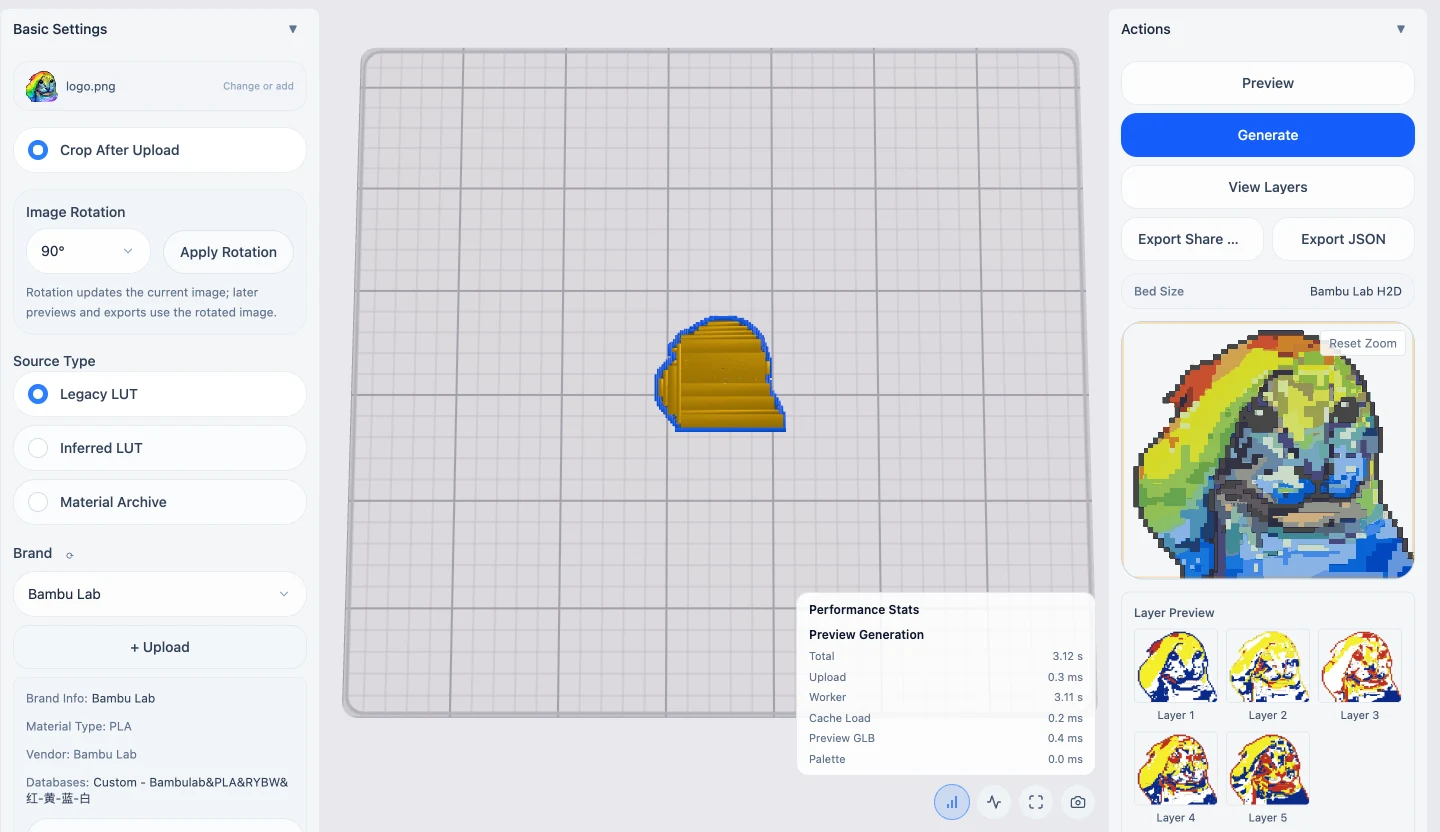
The panel uses timing fields from the latest Preview and Generate responses:
| Field | Meaning |
|---|---|
| Total | total request-to-completion time for that stage |
| Upload processing | time spent receiving and preparing the input |
| Worker | backend worker computation |
| Cache load | reading existing intermediate data |
| Preview GLB | building the segmented model shown by the 3D Viewer |
| Palette | preparing Preview colours and recipe information |
| Overhead | Generate time outside the core worker calculation |
A section appears only when the backend returned its timing data. Performance and Diagnostics are mutually exclusive; opening either closes the other.
Diagnostics
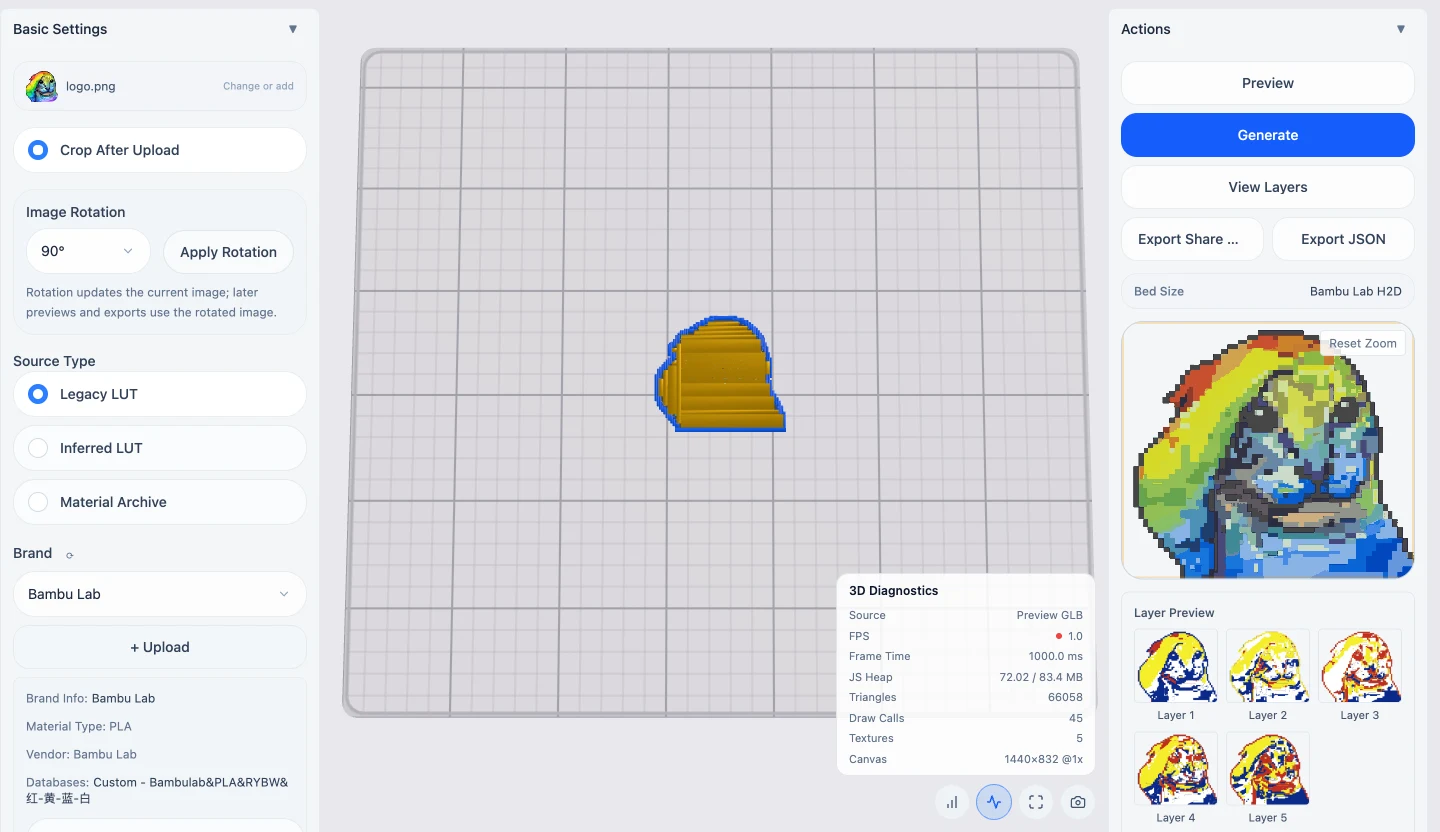
| Field | Meaning |
|---|---|
| Source | Preview GLB, generated model, batch Preview, or idle canvas |
| FPS / frame time | actual browser refresh rate and estimated time per frame |
| JS heap | used and total JavaScript heap when the browser exposes it |
| Triangles | triangles submitted by the current renderer |
| Calls | draw calls in the current frame |
| Textures | textures held by the renderer |
| Canvas | WebGL pixel dimensions and device pixel ratio |
Use Diagnostics to separate slow backend generation from a model that has completed but renders slowly on the local browser. Low FPS with very high triangle or call counts can be improved by disabling unnecessary advanced 3D structures, reducing Preview complexity, and checking browser hardware acceleration. Diagnostics does not judge print quality and does not alter model settings.
Relationship to High-precision 3D color Preview
High-precision 3D color Preview changes how surface colour is displayed. Performance and Diagnostics only observe the current 3D canvas. See High-precision 3D Color Preview for colour-rendering behaviour and limits.
Submit feedback
Your feedback is sent privately to the Wiki maintainers and is not displayed publicly on this page.